FluffOS v2019 除了WEBSOCKET支持和UTF-8支持,还有一个重要的功能就是 lpc trace,可以追踪代码运行细节,新增了二个efun:trace_start 和 trace_end。
驱动运行追踪使用方式简单的说,就是二块内容:1.追踪数据,2.分析数据。
追踪数据
包括二种方式:
全程追踪
在驱动启动时加上 --tracing trace_driver.json 即可,这样会在游戏退出时生成一个trace_driver.json文件,注意可能会造成你内存不足,如果运行时间长,生成的文件也可能非常大。具体参考指令:
./driver --tracing trace_driver.json config.ini游戏中追踪
在游戏中调用efun trace_start("trace.json", 10);会追踪接下来10秒的数据并生成文件trace.json,这个指令的具体说明文档看这里:https://wiki.mud.ren/index.php?title=Trace_start
为了安全,trace_start()最多可追踪5分钟和1百万个事件,你可以调用trace_end()停止追踪。
分析数据
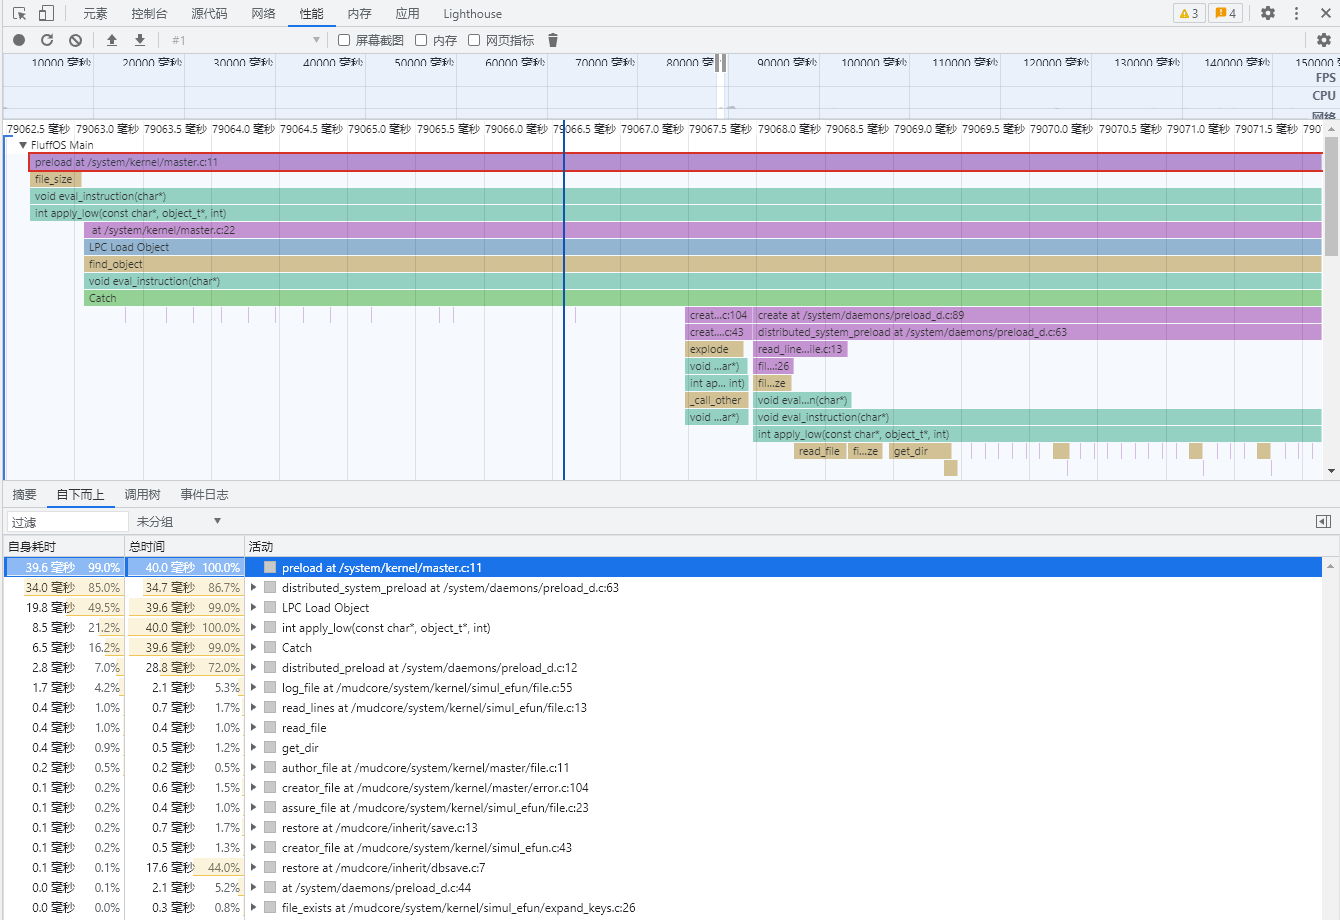
打开谷歌浏览器的开发者工具(路径:菜单-更多工具-开发者工具,或按F12),切换到性能(Performance)选项,把你的json文件拖进来,然后自己分析吧~
Full driver tracing
trace driver from startup, this is suitable if you want an full trace of single run of the driver . This is the method currently used in testsuite.
Execute ./driver --tracing trace_driver.json <config> and driver will automatically collect all traces and save it on exit.
In driver tracing
in LPC , call trace_start("trace.json", 10); , this will have driver to collect trace for the next 10 seconds, If you need to end collection sooner, you can call trace_end() , otherwise driver will automatically stop collecting after timeout.
Analyze output
- Open chrome Devtools
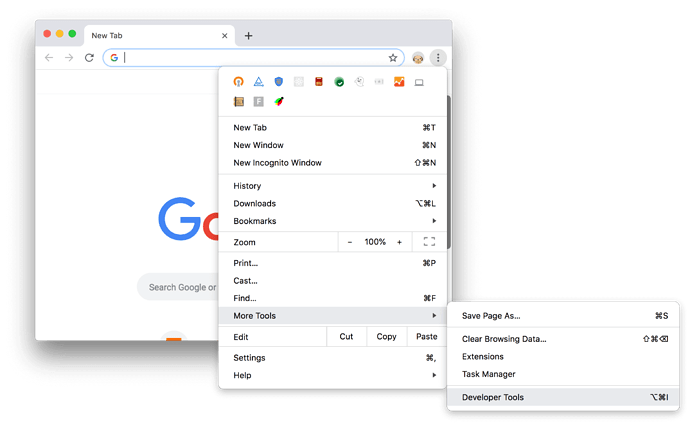
- Open as full window , Switch to “Performance" Tab , and load the trace json.
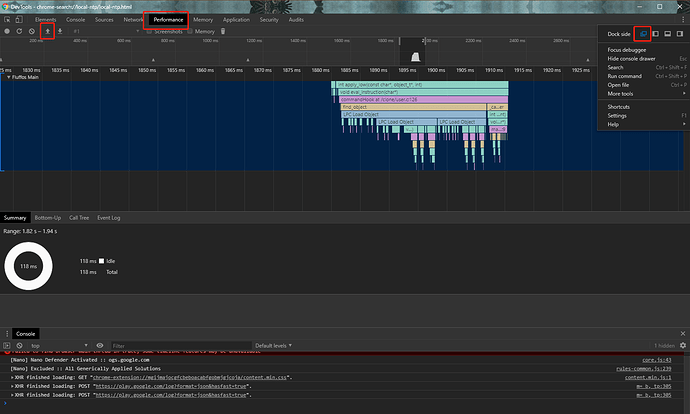
- zoom in and figure out what is costing CPU! As you can see, The trace is color coded, The stack usually start at apply_low() , and the longer the span is, meaning the longer it costs to execute that function. You can zoom in and figure out what has been executing on CPU.
Note
Tracing has performance cost, make sure you don’t run tracing for too long, otherwise driver will run out of memory.
For safety reason, tracing efun is restricted to at most 5 minutes and 1 million events .